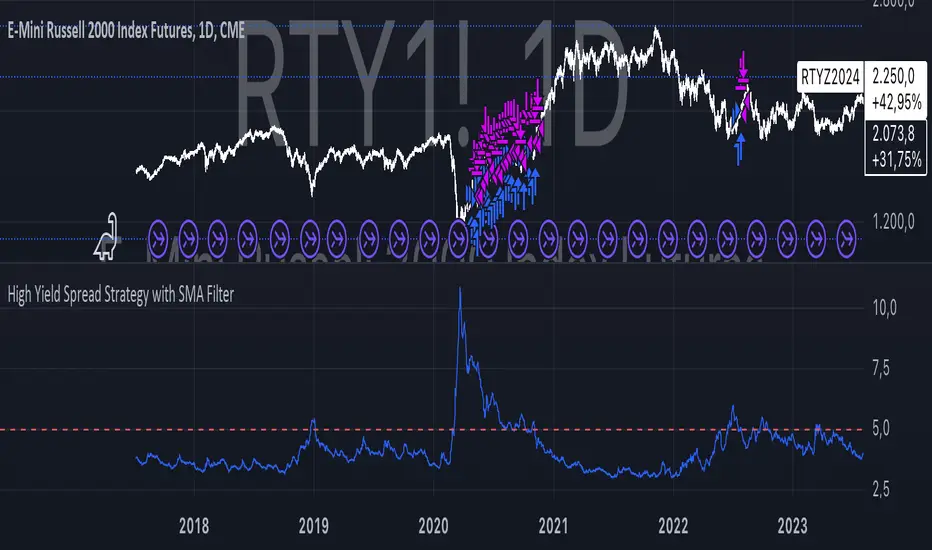
High Yield Spread Strategy with SMA FilterThis Pine Script strategy is designed for statistical analysis and research purposes only, not for live trading or financial decision-making. The script evaluates the relationship between financial volatility (measured by either the VIX or the High Yield Spread) and market positioning strategies (long or short) based on user-defined conditions. Specifically, it allows users to test the assumption that elevated levels of VIX or the High Yield Spread may justify short positions in the market—a widely held belief in financial circles—but this script demonstrates that shorting is not always the optimal choice, even under these conditions.
Key Components:
1. High Yield Spread and VIX:
• High Yield Spread is the difference between the yields of corporate high-yield (or “junk”) bonds and U.S. Treasury securities. A rising spread often reflects increased market risk perception.
• VIX (Volatility Index) is often referred to as the market’s “fear gauge.” Higher VIX levels usually indicate heightened market uncertainty or expected volatility.
2. Strategy Logic:
• The script allows users to specify a threshold for the VIX or High Yield Spread, and it automatically evaluates if the spread exceeds this level, which traditionally would suggest an environment for higher market risk and thus potentially favoring short trades.
• However, the strategy provides flexibility to enter long or short positions, even in a high-risk environment, emphasizing that a high VIX or High Yield Spread does not always warrant shorting.
3. SMA Filter:
• A Simple Moving Average (SMA) filter can be applied to the price data, where positions are only entered if the price is above or below the SMA (depending on the trade direction). This adds a technical component to the strategy, incorporating price trends into decision-making.
4. Hold Duration:
• The script also allows users to define how long to hold a position after entering, enabling an analysis of different timeframes.
Theoretical Background:
The traditional belief that high VIX or High Yield Spreads favor short positions is not universally supported by research. While a spike in the VIX or credit spreads is often associated with increased market risk, research suggests that excessive volatility does not always lead to negative returns. In fact, high volatility can sometimes signal an approaching market rebound.
For example:
• Studies have shown that long-term investments during periods of heightened volatility can yield favorable returns due to mean reversion. Whaley (2000) notes that VIX spikes are often followed by market recoveries as volatility tends to revert to its mean over time .
• Research by Blitz and Vliet (2007) highlights that low-volatility stocks have historically outperformed high-volatility stocks, suggesting that volatility may not always predict negative returns .
• Furthermore, credit spreads can widen in response to broader market stress, but these may overshoot the actual credit risk, presenting opportunities for long positions when spreads are high and risk premiums are mispriced .
Educational Purpose:
The goal of this script is to challenge assumptions about shorting during volatile periods, showing that long positions can be equally, if not more, effective during market stress. By incorporating an SMA filter and customizable logic for entering trades, users can test different hypotheses regarding the effectiveness of both long and short positions under varying market conditions.
Note: This strategy is not intended for live trading and should be used solely for educational and statistical exploration. Misinterpreting financial indicators can lead to incorrect investment decisions, and it is crucial to conduct comprehensive research before trading.
References:
1. Whaley, R. E. (2000). “The Investor Fear Gauge”. The Journal of Portfolio Management, 26(3), 12-17.
2. Blitz, D., & van Vliet, P. (2007). “The Volatility Effect: Lower Risk Without Lower Return”. Journal of Portfolio Management, 34(1), 102-113.
3. Bhamra, H. S., & Kuehn, L. A. (2010). “The Determinants of Credit Spreads: An Empirical Analysis”. Journal of Finance, 65(3), 1041-1072.
This explanation highlights the academic and research-backed foundation of the strategy and the nuances of volatility, while cautioning against the assumption that high VIX or High Yield Spread always calls for shorting.
Cari dalam skrip untuk "the script"
[INVX] Post-Earnings Announcement DriftWhat does this strategy do?
This Pine Script strategy implements the Post-earnings announcement drift (PEAD) strategy, which is a financial market anomaly where a stock's price tends to drift in the direction of the firm's earnings surprise for an extended period of time.
Ref: en.wikipedia.org
An earnings announcement is an official public statement of a company's profitability for a specific time period, typically a quarter or a year. It includes various financial metrics but the most watched figure is the Earnings Per Share (EPS). Analysts estimate the EPS before the announcement, and the actual EPS is compared to this estimate to determine if there was an earnings surprise.
An earnings surprise occurs when the actual EPS is significantly different from the analysts' estimates. A positive earnings surprise indicates that the actual EPS is higher than the estimate, while a negative earnings surprise suggests the EPS is lower than anticipated.
The script takes the following inputs
" Holding periods (bar) " : This input defines the number of periods (or bars) the script will hold a position after the earnings announcement.
" Surprise threshold (%) ": This input sets the minimum percentage for an earnings surprise, which triggers the strategy to enter either a long or short position. In essence, it represents the minimum deviation between the estimated and actual Earnings Per Share (EPS) that will trigger a trade. A higher threshold may lead to fewer, potentially more significant trades, while a lower threshold might result in more frequent, possibly less impactful trades. This parameter allows you to adjust the sensitivity of the strategy to earnings surprises.
Positive earnings surprise
After the earnings announcement, the script compares the actual EPS with the estimated EPS to identify an earnings surprise. If there is a positive earnings surprise, the script will enter a long position. A long position is a bullish strategy where the investor expects the stock price to rise.
Negative earnings surprise
On the other hand, if there is a negative earnings surprise, the script will enter a short position. A short position is a bearish strategy where the investor expects the stock price to fall.
In both scenarios, the position (either long or short) is held for the number of periods specified in the "Holding periods (bar)" input. This strategy is based on the assumption that the stock price will continue to drift in the direction of the earnings surprise for the specified holding period.
Disclaimer: The script provided herein is for educational purposes only. It should not be considered as investment advice or a recommendation of any particular security, strategy or investment product. Past performance is not indicative of future results.
The results of the Pine Script backtesting are hypothetical and should not be considered as a true reflection of the results that might be achieved in a live trading environment. The backtest results are based on historical data and may not take into account certain factors such as actual transaction costs, taxes, or changes in market conditions.
Investors should consult with their financial advisor before making any investment decisions. All investments involve risk, including the potential loss of all invested capital.

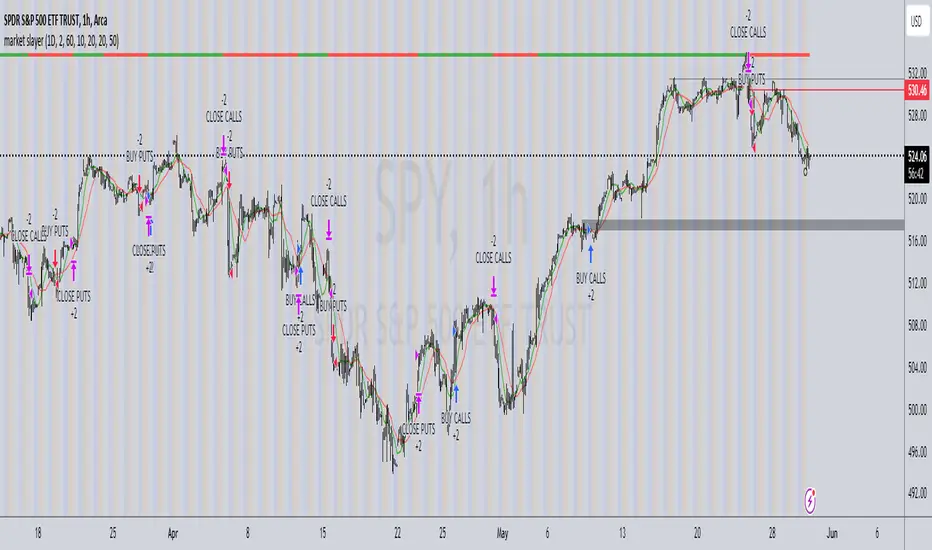
market slayerInput Parameters:
Various input parameters allow customization of the strategy, including options to show trend confirmation, specify trend timeframes and values, set SMA lengths, enable take profit and stop loss, and define their respective values.
Calculations:
Simple Moving Averages (SMAs) are calculated based on the specified lengths.
Buy and sell signals are generated based on the crossover and crossunder of the short and long SMAs.
Confirmation Bars:
Functions are defined to determine bullish or bearish confirmation bars based on certain conditions.
These confirmation bars are used to confirm trend direction and generate additional signals.
Plotting:
SMAs are plotted on the chart.
Trend labels and signal markers are plotted based on the calculated conditions.
Trade Signals:
Buy and sell conditions are defined based on the crossover/crossunder of SMAs and confirmation of trend direction.
Strategy entries and exits are executed accordingly.
Take Profit and Stop Loss:
Optional take profit and stop loss functionality is included.
Trades are automatically closed when profit or loss thresholds are reached.
Closing Trades:
Trades are also closed based on changes in trend confirmation bars to ensure alignment with the overall market direction.
Alerts:
Alert conditions are defined for opening and closing trades, providing notifications when certain conditions are met.
Overall, this script aims to provide a systematic approach to trading by combining moving average crossovers with trend confirmation bars, along with options for risk management through take profit and stop loss orders. Users can customize various parameters to adapt the strategy to different market conditions and trading preferences.
The script uses the request.security() function with the lookahead parameter set to barmerge.lookahead_on to access data from a higher timeframe within the Pine Script on TradingView. Let's break down why it's used:
Higher Timeframe Analysis:
By default, Pine Script operates on the timeframe of the chart it's applied to. However, in trading strategies, it's common to incorporate signals or data from higher timeframes to confirm or validate signals generated on lower timeframes. This helps traders to align their trades with the broader market trend.
Trend Confirmation:
In this script, the confirmationTrendTimeframe parameter allows users to specify a higher timeframe for trend confirmation. The request.security() function fetches the data from this higher timeframe and applies the defined conditions to confirm the trend direction.
Lookahead Behavior:
The lookahead parameter set to barmerge.lookahead_on ensures that the script considers the most up-to-date information available on the higher timeframe when making trading decisions on the lower timeframe. This prevents the script from lagging behind or using outdated data, enhancing the accuracy of trend confirmation.
Usage in confirmationTrendBullish and confirmationTrendBearish:
These variables are assigned the values returned by the request.security() function, which represents the bullish or bearish trend confirmation based on the conditions applied to the data from the higher timeframe.
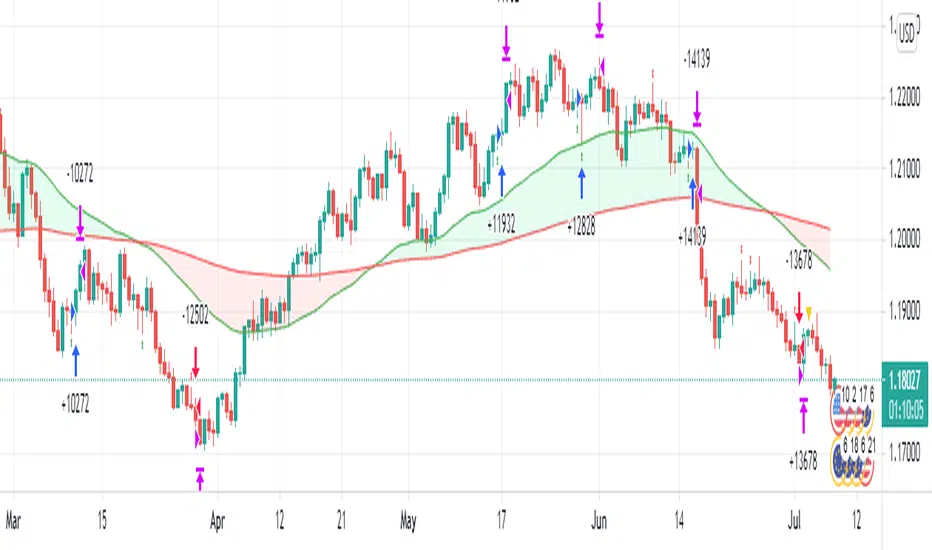
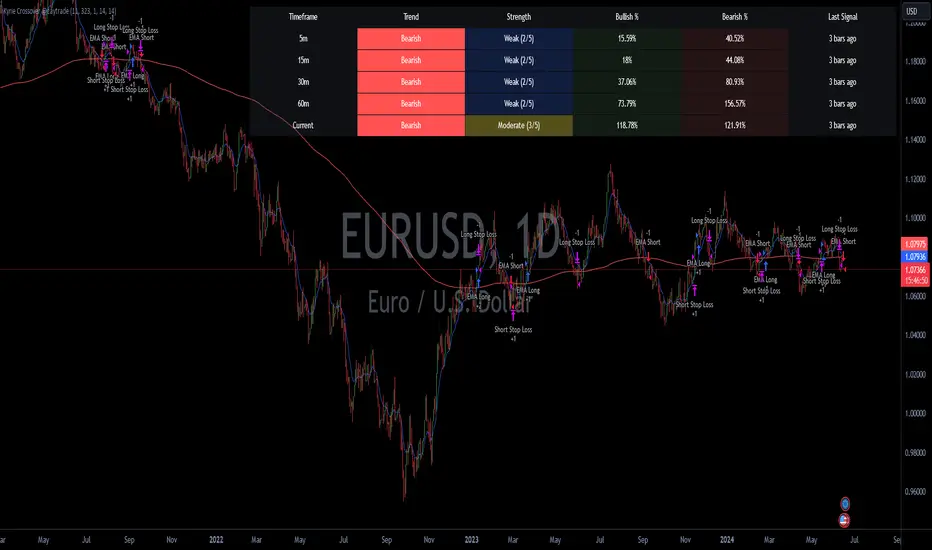
Kyrie Crossover ( @zaytradellc )Unlocking Market Dynamics: Kyrie Crossover Script by @zaytradellc
personalized trading success with the "Kyrie Crossover" script, meticulously crafted by @zaytrade. This innovative Pine Script, tailored to the birthdays of Kyrie and the script creator, combines the power of technical analysis with a touch of personalization to revolutionize your trading experience.
**Exponential Moving Average (EMA) Crossover Strategy:**
At the heart of the "Kyrie Crossover" script lies a sophisticated EMA crossover strategy. By utilizing a 10-period EMA and a 323-period EMA (symbolizing long term price action ), the strategy effectively captures market trends with precision and insight.
- **Short-Term EMA (10-period):** This EMA reacts swiftly to recent price changes, offering heightened sensitivity to short-term fluctuations. It excels in identifying immediate shifts in market sentiment, making it invaluable for pinpointing short-lived trends and potential reversal points.
- **Long-Term EMA (323-period):** In contrast, the long-term EMA provides a broader perspective by smoothing out short-term noise and focusing on longer-term trend direction. Its extended length filters out market noise effectively, providing a clear representation of the underlying trend's momentum and sustainability.
**Directional Movement Index (DMI) Metrics:**
The "Kyrie Crossover" script goes beyond traditional indicators by incorporating DMI metrics across multiple timeframes. By assessing trend strength and direction, traders gain valuable insights into market dynamics, allowing for informed decision-making.
**Simple Instructions to Profit:**
1. **Identify EMA Crossovers:** Look for instances where the short-term EMA (10-period) crosses above the long-term EMA (323-period) for a bullish signal, indicating a potential buying opportunity. Conversely, a crossover where the short-term EMA crosses below the long-term EMA signals a bearish trend and a potential selling opportunity.
2. **Confirm with DMI Metrics:** Validate EMA crossovers by checking DMI metrics across different timeframes (5 minutes, 15 minutes, 30 minutes, and 1 hour). Pay attention to color-coded indicators, with green indicating a bullish trend, red indicating a bearish trend, and white indicating no clear trend.
3. **Manage Risk:** Implement proper risk management techniques, such as setting stop-loss orders and position sizing based on your risk tolerance and trading objectives.
4. **Stay Informed:** Regularly monitor market conditions and adjust your trading strategy accordingly based on new signals and emerging trends.
CULTURATRADING STRATEGYThe "CULTURATRADING STRATEGY" is designed to capitalize on market trends by incorporating a combination of technical indicators that signal potential entry and exit points for trades on various assets. This strategy is not just a mere collection of indicators but a well-thought-out approach that synergizes different market signals to optimize trade decisions.
The script uses the MACD (Moving Average Convergence Divergence) to gauge momentum and trend direction, with the slope of the MACD line serving as a trigger for market entries. A positive slope suggests an upward trend and potential long entry, while a negative slope indicates a downward trend and a possible short entry.
In tandem with the MACD, the ADX (Average Directional Index) is utilized to measure the strength of the trend. An ADX value above 25 signifies a strong trend, which, when aligned with MACD signals, can validate the trade entries.
The RSI (Relative Strength Index) is another critical component, identifying overbought and oversold conditions. This strategy looks for crossovers above and below key levels (60 for overbought, 40 for oversold) to determine high-probability turning points in the market. The inclusion of a 20-period SMA (Simple Moving Average) of the RSI adds a layer to filter the signals further, allowing for the refinement of entry and exit points.
The script employs a dynamic stop-loss system, set at the lowest low of the past 20 bars for long positions and the highest high for shorts, to manage risk effectively. The strategy is configured for a $10,000 account, risking a reasonable portion of capital per trade, with a pyramid effect to allow for diversified entries from various signals. The backtesting results are based on a 5% capital allocation per trade and include a 0.08% commission. To ensure accurate backtesting, the script includes an additional percentage to account for slippage within the commission.
To provide a comprehensive understanding, the script also outputs a "volatility histogram" based on the ADX, offering insights into market volatility and helping to time the trades better.
This strategy has been backtested across different timeframes and assets, showing resilience in various market conditions. It is essential to check the 'recalculate after order filled' option due to the dynamic nature of stop-loss orders.
This script is paired with the "CULTURATRADING INDICATOR" for enhanced signal clarity, providing a holistic view of the strategy's performance. Please note that this script is for educational purposes and should not be taken as financial advice.
The "CULTURATRADING INDICATOR" is an essential tool that works in conjunction with the "CULTURATRADING STRATEGY" to provide traders with a clear visualization of the market's conditions. It enhances the strategy by offering visual cues that help interpret complex market data more intuitively.
The indicator displays key RSI levels, such as 60 for overbought conditions and 40 for oversold conditions, with a mid-level at 55 to indicate when a trend may be weakening. The colors on the RSI line change to reflect these conditions, offering a quick reference for traders: a blue color signifies an RSI above 60, indicating overbought conditions; a red color shows an RSI below 40, pointing to oversold conditions; and white represents values in between, suggesting a neutral state.
Moreover, the volatility histogram, which is part of the "CULTURATRADING INDICATOR," provides a visual representation of market volatility. The histogram changes colors based on the ADX value and the slope of the MACD line. For instance, a green histogram suggests a positive MACD slope during a strong trend, indicating potential bullish momentum. Conversely, a red histogram implies a negative MACD slope during strong trends, hinting at bearish momentum. A grey color might be used to represent periods when the trend is weak or the market is less volatile.
Together, these visual elements of the "CULTURATRADING INDICATOR" complement the strategy's signals, providing traders with an at-a-glance summary of the current market scenario, which can be particularly useful when managing multiple trades or assessing opportunities quickly.
Please remember, this script and its associated indicator are designed to serve as educational tools to assist in understanding market dynamics and are not intended as financial advice. Always conduct your own research and consider consulting a financial advisor for personalized guidance.

IU Break of any session StrategyHow this script works:
1. This script is an intraday trading strategy script which buy and sell on the bases of user-defined intraday session range breakout and gives alert(if the alert is set) message too when the new position is open.
2. It calculate the session as per the user inputs or user defined custom session.
3. The script stores the highest and lowest value of the whole session.
4. It take a long position on the first break and close above the highest value.
5. It take a short position on the break and close below the lowest value.
6. The script takes one position in one day.
7. The stop loss for this script is the previous low(if long) or high(if short).
8. Take profit is 1:2 and it's adjustable.
9. This script work on every kind of market.
How The Useful For The User :
1. User can backtest any session range breakout he wants to trade.
2. User can get alert when the new position is open.
3. User can change the Risk to Reward in order to find the best Risk to Reward.
4. User can see the highest and lowest value of the session with respect to analyzing his trading objective.
5. This strategy script highlights which session range breakout performs best and which performs worst.

SOFEX Strong Volatility Trend Follower + BacktestingWhat is the SOFEX Strong Volatility Trend Follower + Backtesting script?
🔬 Trading Philosophy
This script is trend-following, attempting to avoid choppy markets.
It has been developed for Bitcoin and Ethereum trading, on 1H timeframe.
The strategy does not aim to make a lot of trades, or to always remain in a position and switch from long to short. Many times there is no direction and the market is in "random walk mode", and chasing trades is futile.
Expectations of performance should be realistic.
The script focuses on a balanced take-profit to stop-loss ratio. In the default set-up of the script, that is a 2% : 2% (1:1) ratio. A relatively low stop loss and take profit build onto the idea that positions should be exited promptly. There are many options to edit these values, including enabling trailing take profit and stop loss. Traders can also completely turn off TP and SL levels, and rely on opposing signals to exit and enter new trades.
Extreme scenarios can happen on the cryptocurrency markets, and disabling stop-loss levels completely is not recommended. The position size should be monitored since all of it is at risk with no stop-loss.
⚙️ Logic of the indicator
The Strong Volatility Trend Follower indicator aims at evading ranging market conditions. It does not seek to chase volatile, yet choppy markets. It aims at aggressively following confirmed trends. The indicator works best during strong, volatile trends, however, it has the downside of entering trades at trend tops or bottoms.
This indicator also leverages proprietary adaptive moving averages to identify and follow strong trend volatility effectively. Furthermore, it uses the Average Directional Index, Awesome Oscillator, ATR and a modified version of VWAP, to categorize trends into weak or strong ones. The VWAP indicator is used to identify the monetary (volume) inflow into a given trend, further helping to avoid short-term manipulations. It also helps to distinguish choppy-market volatility with a trending market one.
📟 Parameters Menu
The script has a comprehensive parameter menu:
Preset Selection : Choose between Bitcoin or Ethereum presets to tailor the indicator to your preferred cryptocurrency market.
Indicator Sensitivity Parameter : Adjust the sensitivity to adapt the indicator, particularly to make it seek higher-strength trends.
Indicator Signal Direction : Set the signal direction as Long, Short, or Both, depending on your preference.
Exit of Signals : You have options regarding Take-Profit (TP) and Stop-Loss (SL) levels. Enable TP/SL levels to exit trades at predetermined levels, or disable them to rely on direction changes for exits. Be aware that removing stop losses can introduce additional risk, and position sizing should be carefully monitored.
By enabling Trailing TP/SL, the system switches to a trailing approach, allowing you to:
- Place an initial customizable SL.
- Specify a level (%) for the Trailing SL to become active.
- When the activation level is reached, the system moves the trailing stop by a given Offset (%).
Additionally, you can enable exit at break-even, where the system places an exit order when the trail activation level is reached, accounting for fees and slippage.
Alert Messages : Define the fields for alert messages based on specific conditions. You can set up alerts to receive email, SMS, and in-app notifications. If you use webhooks for alerts, exercise caution, as these alerts can potentially execute trades without human supervision.
Backtesting : Default backtesting parameters are set to provide realistic backtesting performance:
- 0.04% Commission per trade (for both entries and exits)
- 3 ticks Slippage (highly dependent on exchange)
- Initial capital of $1000
- Order size of $1000
While the order size is equal to the initial capital, the script employs a 2% stop-loss order to limit losses and attempts to prevent risky trades from creating big losses. The order size is a set dollar value, so that the backtesting performance is linear, instead of using % of capital which may result in unrealistic backtesting performance.
Risk Disclaimer
Please be aware that backtesting results, while valuable for statistical overview, do not guarantee future performance in any way. Cryptocurrency markets are inherently volatile and risky. Always trade responsibly and do not risk more than you can afford to lose.

Based RSI (BullDozz)Installation: To use this script, open TradingView and create a new Pine Script strategy. You can paste the code provided into the Pine Script editor.
Customizable Inputs: The script includes various input parameters that you can customize to fit your trading preferences. These parameters are defined using the input function and include values like length, TPPercent, and others. You can adjust these values based on your trading strategy.
Strategy Signals: The script generates buy and sell signals based on the conditions specified in the buySignal and sellSignal variables. These signals are derived from the analysis of the oscillator (osc) and the Relative Strength Index (rsi). When a buy signal occurs, the script enters a long position, and when a sell signal occurs, it enters a short position.
Take Profit: The script includes a take profit feature (useTP) that allows you to enable or disable take profit orders. When enabled, it calculates take profit levels based on the specified percent (TPPercent) and attaches them to the open positions.
Plotting: The script also visualizes the oscillator (osc) and a midline (0) on the chart using histogram-style bars. The colors of these bars change based on the oscillator's direction.

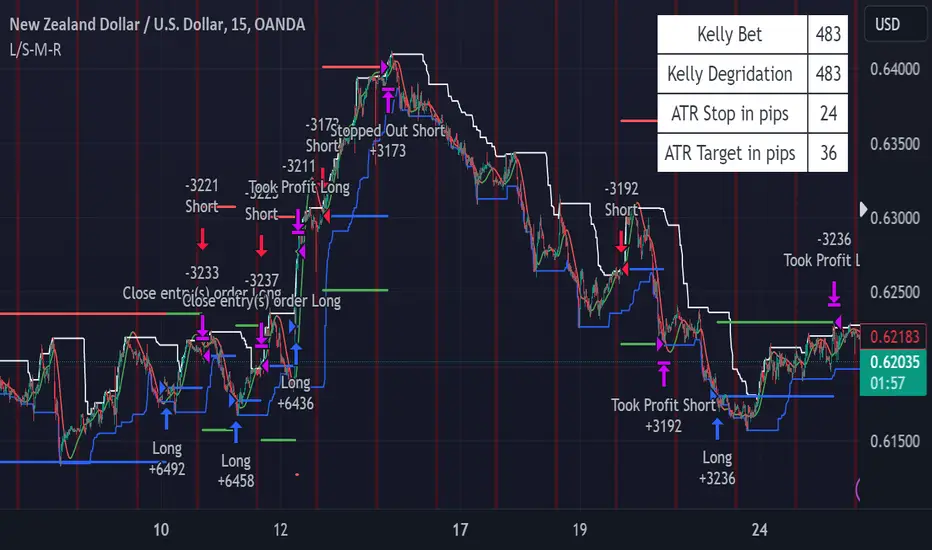
METRIC-TREND-TRADERThis script is a Fully Automated trading script meant to be used with "Oanda" broker and the plug-ins for algorithmic trading automation.( FOREX ONLY)
This script is meant to capture "TREND FOLLOWING " for intraday charts (1hour) preferably and will hold for days / weeks .trading on forex markets.
(The combination of indicators includes a short high and low price channel and a longer term high and low price channel)
This script is original in description as being automated to try and capture dynamic trending markets with both long and short fractal price channels. although trend trading is not an original concept. trend trading with this dynamic indicator allows the user visualize both short term and longer term price action at the same time, helping to make better trading decisions. the channels are designed to buy breakouts in the direction of the longer term trend while trailing stop a built-in stop loss that allows normal market movement while attempting to lock in flexible profits.
The concept of this indicator is be able to quickly visualize trends by high lighting the large green areas beneath price "when trending long" which is the difference between the (user defined) short term lows and the (user defined) Long period price lows.
For "down trending" markets a large red area above price will be displayed and this is the difference between the (user defined) short term highs and the (user defined) long term highs.
This strategy uses a lower than reward profile to jump in direction of market moves for continuation,
(1 risk to 4 reward)
in the likelihood the instrument will continue (example) 200 pips before it reverts 50 pips in the counter direction.
This strategy should only be used in markets that you believe are "TRENDING" at the time of trading otherwise you risk trend trading a range market.
This script uses a (user defined period) of short term high and low price ( green/red color) and (user defined period) Long Term high and low price (green/red) chosen in the indicator settings menu.
The default parameters are 10 with a (minimum of 1 and maximum of 10000) for the short term channel and 50 with a (minimum of 1 and maximum of 10000) for the long term price channel , the default parameters = roughly 2 days "long term" and 10 hours "short term" of price action on the (1 hour) chart.
Strategy entries and exits , for Long trades the trade will be entered if the short term high crosses above the Long Term high and the Short term low is not equal to the Long term low . the trade will exit if profit or stop loss are hit or if the Short term low crosses under the long term low.
For Short trades the trade will enter short if , the short term low crosses under the long term low and the short term high is not equal to the long term high. the trade will exit if profit or stop loss are hit or the short term high crosses over the long term high
"The default parameters should be kept unless you fully understand the complete strategy"
There are two very important inputs to be selected at the user setting menu "Long Only " and "Short Only" if you are looking to place long trades only select "Long Only" or for short trades select " Short Only" it is not recommended to keep both selected as it will trade both sides!
When the trade is entered a red , a blue and green horizontal dotted line will appear on the chart.
the blue line is the strategy entry price , the red line is the stop loss price , and the green line is the take profit price . the colors will invert if the trade is long or short.
(Setting alerts should be done in the indicator settings menu, and the parameters you chose will determine the stop loss/target and the amount of "units = (position size)" you wish to trade for the (forex only) markets. using "alert() function calls only" is the only alert that should be used with this strategy.
(note : when "alert() function calls only" is set two messages will be sent, one closing any open position in the opposite direction and one placing the new order regardless if you are currently in a trade or not)
Trade targets , stoploss and trade position size are a user defined variables entered in the indicator settings menu. (target pips minimum 0 and a maximum of 1000)(stop pips minimum of 0 and maximum of 1000)
Back test date range is included in the script for back testing different data periods.
the back ground will be colored a transparent navy blue if the period you are looking trading is with in the date range( note: to place live trades the end date will need to be in the future)
this is also adjustable in the settings menu
The avoid spread filter is a user defined time in which the spread is typically higher than average, applying this filter avoids trades in the specified time. When this filter is applied there will be a transparent red back ground color in the specified time.
Back test default setting are equivocal to OANDA:USDJPY
at the time of this publication placing trades with the "Oanda" broker are as follows , USD units = 2000 equal 2000 USD position size . "Oanda" current leverage is 20 to 1 for this particular pair and commission is paid in spread (1.4) pips = 0.19 USD per trade , Margin required for the trade is 100.0 USD , Position sizing = 10% of a 1000 USD account.
OANDA:USDJPY

PRICE CHANNEL MEAN REVERSIONThis script is a Fully Automated trading script meant to be used with "Oanda" broker and the plug-ins for algorithmic trading automation.( FOREX ONLY)
This script is meant to capture "MEAN REVERSION " for intraday charts (1hour) preferably and will hold for days / weeks .trading on forex markets.
(The combination of indicators includes a high and low price channel along with a fast moving average)
This script is original in the description of Alan Hulls moving average combined with the high and low closing of price action.
The concept of this mean reversion strategy is to try and capture price exhaustive moves . The moving average is fast and most times remains in the channel. when the moving average overshoots the channel the average price of the instrument is thought to be rising or falling faster then average, indicating a possibility that the instrument may revert (pull back) this strategy aims to capture that pull back.
This strategy uses a higher risk than reward profile to jump in front of market moves (4 risk to 1 reward)
in the likelihood the instrument will revert back (example) 25 pips before it continues 100 pips in the current direction.
This strategy should only be used in markets that you believe are mean reverting at the time of trading otherwise you will be jumping Infront of a possible trend and the price can continue in the trending direction for an unknown specified amount of time.
This script uses a (user defined period) fast moving average ( green/red color) and (user defined period) price channel (White/Blue) chosen in the indicator settings menu.
The default parameters are 55 with a (minimum of 1 and maximum of 10000) for the moving average and 50 with a (minimum of 1 and maximum of 10000) for the price channel , the default parameters = roughly 2 days of price action on the (1 hour) chart.
"The default parameters should be kept unless you fully understand the complete strategy"
the upper band (white line) is the highest close of the specified period and the lower band (blue line) is the lowest close of the same period.
When the fast moving average over shoots the price channel (exits) then crosses back into the price channel (enters) it will trigger a long or short trade.
The long signal is given when the the moving average crosses below the low band then crosses back above the low band . The trade long trade will be entered and the trade will exit if the stop loss or profit targets are hit or if the short signal is given the trade will close then reverse.
The short trade will be entered if the fast moving average crosses above the upper band (white line) then crosses back down through the upper band (white line) The trade short trade will be entered and the trade will exit if the stop loss or profit targets are hit or if the long signal is given the trade will close then reverse.
When the trade is entered a red , a blue and green horizontal dotted line will appear on the chart.
the blue line is the strategy entry price , the red line is the stop loss price , and the green line is the take profit price . the colors will invert if the trade is long or short.
(Setting alerts should be done in the indicator settings menu, and the parameters you chose will determine the stop loss/target and the amount of "units = (position size)" you wish to trade for the (forex only) markets. using "alert() function calls only" is the only alert that should be used with this strategy.
(note : when "alert() function calls only" is set two messages will be sent, one closing any open position in the opposite direction and one placing the new order regardless if you are currently in a trade or not)
Trade targets , stoploss and trade position size are a user defined variables entered in the indicator settings menu. (target pips minimum 0 and a maximum of 1000)(stop pips minimum of 0 and maximum of 1000)
Back test date range is included in the script for back testing different data periods.
the back ground will be colored a transparent navy blue if the period you are looking trading is with in the date range( note: to place live trades the end date will need to be in the future)
this is also adjustable in the settings menu
The avoid spread filter is a user defined time in which the spread is typically higher than average, applying this filter avoids trades in the specified time. When this filter is applied there will be a transparent red back ground color in the specified time.
Back test default setting are equivocal to OANDA:NZDUSD
at the time of this publication placing trades with the "Oanda" broker are as follows , NZD units = 3250 equal 2000 USD position size . "Oanda" current leverage is 33.3 to 1 for this particular pair and commission is paid in spread (1.7) pips = 0.55 USD per trade , Margin required for the trade is 60.50 USD , Position sizing = 6.5% of a 1000 USD account. OANDA:NZDUSD
BTC 4h bot 2.0 StrategyThis is Strategy version of BTC 4h bot 2.0.
Optimized for pairs BTC vs stablecoins, 4h timeframe.
HOW IT WORKS:
Script is based on the fact that there are certain phases of the market when there is a greater probability that BTC will go to one side or the other. To evaluate which phase we are in, the script uses "Main trend" and "Confirmation signals".
Main trend
- Is composed of a combination of several supertrends and moving averages. A Supertrend is a trend following indicator that helps in identifying whether we are in an uptrend or a downtrend. A higher factor is used to capture the main trend and not just small movements. In case the market goes sideways, the Supertrend does not work well, so it is a combination of multiple supertrends along with moving averages to differentiate a real strong trend from a range.
- It can be seen on the graph as a thick solid line.
- In an uptrend is green, in a downtrend red, gray represents the neutral zone.
Confirmation signals
- Are several script-evaluated indicators such as RSI , MACD , ADX and others, which serve to confirm the trend. In this case, it is the opposite way to the Main trend. Confirmation signals are used here to detect small movements. They are trying to capture bullish and bearish price momentum.
- On the graph they are seen as dashed lines above or below the Main trend (in the gray zone they are in the middle).
- It indicates only two signals, green for buy and red for sell.
HOW TO USE IT:
if the Main trend and Confirmation signals are of the same color, it will send a buy or sell signal, depending on which phase of the trend it is in. If the Main trend is e.g. in an uptrend and the market is going up, Confirmation signals should generate a lot of signals. But if the market starts to go in the opposite direction, Confirmation signals should generate fewer signals or none at all, thus reducing the number of wrong trades. In the gray zone of the Main trend it does not open positions.
To close position is possible to use stop loss and take profit or alternative could be to set very high TP value, thereby letting the script close the positions by itself.
The default setting is:
TP: 3.9%
SL: 4.7%.
In this case, it is a strategy to find out how the script worked in the past period. The longest period in which it is possible to test BTCUSD is on the Bitstamp exchange. The script works consistently well over a long period of time, using past probabilities, but this does not guarantee future results.

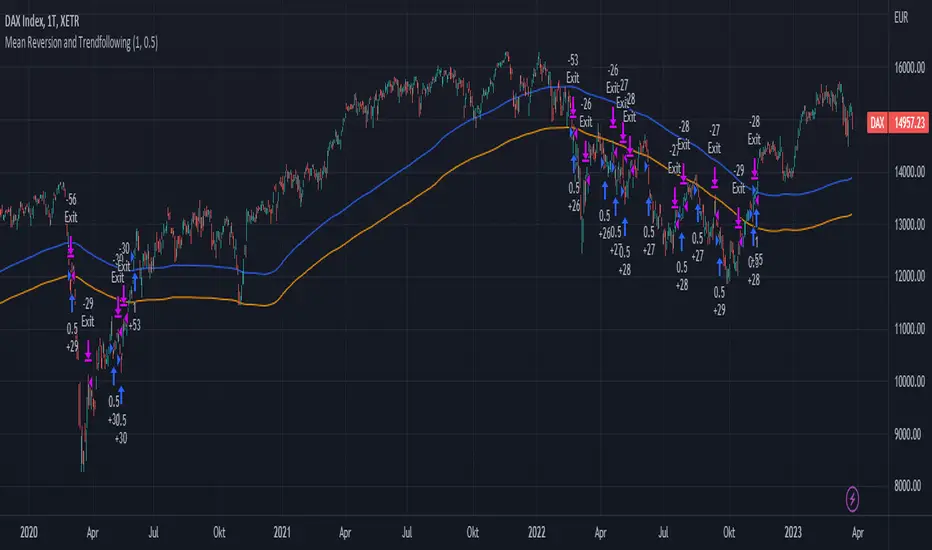
Mean Reversion and TrendfollowingTitle: Mean Reversion and Trendfollowing
Introduction:
This script presents a hybrid trading strategy that combines mean reversion and trend following techniques. The strategy aims to capitalize on short-term price corrections during a downtrend (mean reversion) as well as ride the momentum of a trending market (trend following). It uses a 200-period Simple Moving Average (SMA) and a 2-period Relative Strength Index (RSI) to generate buy and sell signals.
Key Features:
Combines mean reversion and trend following techniques
Utilizes 200-period SMA and 2-period RSI
Customizable starting date
Allows for enabling/disabling mean reversion or trend following modes
Adjustable position sizing for trend following and mean reversion
Script Description:
The script implements a trading strategy that combines mean reversion and trend following techniques. Users can enable or disable either of these techniques through the input options. The strategy uses a 200-period Simple Moving Average (SMA) and a 2-period Relative Strength Index (RSI) to generate buy and sell signals.
The mean reversion mode is active when the price is below the SMA200, while the trend following mode is active when the price is above the SMA200. The script generates buy signals when the RSI is below 20 (oversold) in mean reversion mode or when the price is above the SMA200 in trend following mode. The script generates sell signals when the RSI is above 80 (overbought) in mean reversion mode or when the price falls below 95% of the SMA200 in trend following mode.
Users can adjust the position sizing for both trend following and mean reversion modes using the input options.
To use this script on TradingView, follow these steps:
Open TradingView and load your preferred chart.
Click on the 'Pine Editor' tab located at the bottom of the screen.
Paste the provided script into the Pine Editor.
Click 'Add to Chart' to apply the strategy to your chart.
Please note that the past performance of any trading system or methodology is not necessarily indicative of future results. Always use proper risk management and consult a financial advisor before making any investment decisions.
------
The following is a summary of the underlying whitepaper (onlinelibrary.wiley.com) for this strategy:
This paper proposes a theory of securities market under- and overreactions based on two psychological biases: investor overconfidence about the precision of private information and biased self-attribution, which causes asymmetric shifts in investors' confidence as a function of their investment outcomes. The authors show that overconfidence implies negative long-lag autocorrelations, excess volatility, and public-event-based return predictability. Biased self-attribution adds positive short-lag autocorrelations (momentum), short-run earnings "drift," and negative correlation between future returns and long-term past stock market and accounting performance.
The paper explains that there is empirical evidence challenging the traditional view that securities are rationally priced to reflect all publicly available information. Some of these anomalies include event-based return predictability, short-term momentum, long-term reversal, high volatility of asset prices relative to fundamentals, and short-run post-earnings announcement stock price "drift."
The authors argue that investor overconfidence can lead to stock prices overreacting to private information signals and underreacting to public signals. This overreaction-correction pattern is consistent with long-run negative autocorrelation in stock returns, excess volatility, and further implications for volatility conditional on the type of signal. The market's tendency to over- or underreact to different types of information allows the authors to address the pattern that average announcement date returns in virtually all event studies are of the same sign as the average post-event abnormal returns.
Biased self-attribution implies short-run momentum and long-term reversals in security prices. The dynamic analysis based on biased self-attribution can also lead to a lag-dependent response to corporate events. Cash flow or earnings surprises at first tend to reinforce confidence, causing a same-direction average stock price trend. Later reversal of overreaction can lead to an opposing stock price trend.
The paper concludes by summarizing the findings, relating the analysis to the literature on exogenous noise trading, and discussing issues related to the survival of overconfident traders in financial markets.
Simple_RSI+PA+DCA StrategyThis strategy is a result of a study to understand better the workings of functions, for loops and the use of lines to visualize price levels. The strategy is a complete rewrite of the older RSI+PA+DCA Strategy with the goal to make it dynamic and to simplify the strategy settings to the bare minimum.
In case you are not familiar with the older RSI+PA+DCA Strategy, here is a short explanation of the idea behind the strategy:
The idea behind the strategy based on an RSI strategy of buying low. A position is entered when the RSI and moving average conditions are met. The position is closed when it reaches a specified take profit percentage. As soon as the first the position is opened multiple PA (price average) layers are setup based on a specified percentage of price drop. When the price hits the layer another position with the same position size is is opened. This causes the average cost price (the white line) to decrease. If the price drops more, another position is opened with another price average decrease as result. When the price starts rising again the different positions are separately closed when each reaches the specified take profit. The positions can be re-opened when the price drops again. And so on. When the price rises more and crosses over the average price and reached the specified Stop level (the red line) on top of it, it closes all the positions at once and cancels all orders. From that moment on it waits for another price dip before it opens a new position.
This is the old RSI+PA+DCA Strategy:
The reason to completely rewrite the code for this strategy is to create a more automated, adaptable and dynamic system. The old version is static and because of the linear use of code the amount of DCA levels were fixed to max 6 layers. If you want to add more DCA layers you manually need to change the script and add extra code. The big difference in the new version is that you can specify the amount of DCA layers in the strategy settings. The use of 'for loops' in the code gives the possibility to make this very dynamic and adaptable.
The RSI code is adapted, just like the old version, from the RSI Strategy - Buy The Dips by Coinrule and is used for study purpose. Any other low/dip finding indicator can be used as well
The distance between the DCA layers are calculated exponentially in a function. In the settings you can define the exponential scale to create the distance between the layers. The bigger the scale the bigger the distance. This calculation is not working perfectly yet and needs way more experimentation. Feel free to leave a comment if you have a better idea about this.
The idea behind generating DCA layers with a 'for loop' is inspired by the Backtesting 3commas DCA Bot v2 by rouxam .
The ideas for creating a dynamic position count and for opening and closing different positions separately based on a specified take profit are taken from the Simple_Pyramiding strategy I wrote previously.
This code is a result of a study and not intended for use as a full functioning strategy. To make the code understandable for users that are not so much introduced into pine script (like myself), every step in the code is commented to explain what it does. Hopefully it helps.
Enjoy!

Rsi strategy for BTC with (Rsi SPX)
I hope this strategy is just an idea and a starting point, I use the correlation of the Sp500 with the Btc, this does not mean that this correlation will exist forever!. I love Trading view and I'm learning to program, I find correlations very interesting and here is a simple strategy.
This is a trading strategy script written in Pine Script language for use in TradingView. Here is a brief overview of the strategy:
The script uses the RSI (Relative Strength Index) technical indicator with a period of 14 on two securities: the S&P 500 (SPX) and the symbol corresponding to the current chart (presumably Bitcoin, based on the variable name "Btc_1h_fixed"). The RSI is plotted on the chart for both securities.
The script then sets up two trading conditions using the RSI values:
A long entry condition: when the RSI for the current symbol crosses above the RSI for the S&P 500, a long trade is opened using the "strategy.entry" function.
A short entry condition: when the RSI for the current symbol crosses below the RSI for the S&P 500, a short trade is opened using the "strategy.entry" function.
The script also includes a take profit input parameter that allows the user to set a percentage profit target for closing the trade. The take profit is set using the "strategy.exit" function.
Overall, the strategy aims to take advantage of divergences in RSI values between the current symbol and the S&P 500 by opening long or short trades accordingly. The take profit parameter allows the user to set a specific profit target for each trade. However, the script does not include any stop loss or risk management features, which should be considered when implementing the strategy in a real trading scenario.

Rocket Grid Algorithm - The Quant ScienceThe Rocket Grid Algorithm is a trading strategy that enables traders to engage in both long and short selling strategies. The script allows traders to backtest their strategies with a date range of their choice, in addition to selecting the desired strategy - either SMA Based Crossunder or SMA Based Crossover.
The script is a combination of trend following and short-term mean reversing strategies. Trend following involves identifying the current market trend and riding it for as long as possible until it changes direction. This type of strategy can be used over a medium- to long-term time horizon, typically several months to a few years.
Short-term mean reversing, on the other hand, involves taking advantage of short-term price movements that deviate from the average price. This type of strategy is usually applied over a much shorter time horizon, such as a few days to a few weeks. By rapidly entering and exiting positions, the strategy seeks to capture small, quick gains in volatile market conditions.
Overall, the script blends the best of both worlds by combining the long-term stability of trend following with the quick gains of short-term mean reversing, allowing traders to potentially benefit from both short-term and long-term market trends.
Traders can configure the start and end dates, months, and years, and choose the length of the data they want to work with. Additionally, they can set the percentage grid and the upper and lower destroyers to manage their trades effectively. The script also calculates the Simple Moving Average of the chosen data length and plots it on the chart.
The trigger for entering a trade is defined as a crossunder or crossover of the close price with the Simple Moving Average. Once the trigger is activated, the script calculates the total percentage of the side and creates a grid range. The grid range is then divided into ten equal parts, with each part representing a unique grid level. The script keeps track of each grid level, and once the close price reaches the grid level, it opens a trade in the specified direction.
The equity management strategy in the script involves a dynamic allocation of equity to each trade. The first order placed uses 10% of the available equity, while each subsequent order uses 1% less of the available equity. This results in the allocation of 9% for the second order, 8% for the third order, and so on, until a maximum of 10 open trades. This approach allows for risk management and can help to limit potential losses.
Overall, the Rocket Grid Algorithm is a flexible and powerful trading strategy that can be customized to meet the specific needs of individual traders. Its user-friendly interface and robust backtesting capabilities make it an excellent tool for traders looking to enhance their trading experience.

LuxAlgo - Backtester (S&O)The S&O Backtester is an innovative strategy script that encompasses features + optimization methods from our Signals & Overlays™ toolkit and combines them into one easy-to-use script for backtesting the most detailed trading strategies possible.
Our Signals & Overlays™ toolkit is notorious for its signal optimization methods such as the 'Optimal Sensitivity' displayed in its dashboard which provides optimization backtesting of the Sensitivity parameter for the Confirmation & Contrarian Signals.
This strategy script allows even more detailed & precise backtests than anything available previously in the Signals & Overlays™ toolkit; including External Source inputs allowing users to use any indicator including our other paid toolkits for take profit & stop loss customization to develop strategies, along with 10+ pre-built filters directly Signals & Overlays™' features.
🔶 Features
Full Sensitivity optimization within the dashboard to find the Best Win rates or Best Profits.
Counter Trade Mode to reverse signals in undesirable market conditions (may introduce higher drawdowns)
Built-in filters for Confirmation Signals w/ Indicator Overlays from Signals & Overlays™.
Built-in Confirmation exit points are available within the settings & on by default.
External Source Input to filter signals or set custom Take Profits & Stop Losses.
Optimization Matrix dashboard option showing all possible permutations of Sensitivity.
Option to Maximize for Winrate or Best Profit.
🔶 Settings
Sensitivity signal optimizations for the Confirmation Signals algorithm
Buy & Sell conditions filters with Indicator Overlays & External Source
Take Profit exit signals option
External Source for Take Profit & Stop Loss
Sensitivity ranges
Backtest window default at 2,000 bars
External source
Dashboard locations
🔶 Usage
Backtests are not necessarily indicative of future results, although a trader may want to use a strategy script to have a deeper understanding of how their strategy responds to varying market conditions, or to use as a tool for identifying possible flaws in a strategy that could potentially be indicative of good or bad performance in the future.
A strategy script can also be useful in terms of it's ability to generate more complete & configurable alerts, giving users the option to integrate with external processes.
In the chart below we are using default settings and built-in optimization parameters to generate the highest win rate.
Results like the above will vary & finding a strategy with a high win rate does not necessarily mean it will persist into the future, however, some indications of a well-optimized strategy are:
A high number of closed trades (100+) with a consistently green equity curve
An equity curve that outperforms buy & hold
A low % max drawdown compared to the Net Profit %.
Profit factor around 1.5 or above
In the chart below we are using the Trend Catcher feature from Signals & Overlays™ as a filter for standard Confirmation Signals + exits on a higher timeframe.
By filtering bullish signals only when the Trend Catcher is bullish, as well as bearish signals for when the Trend Catcher is bearish, we have a highly profitable strategy created directly from our flagship features.
While the Signals & Overlays features being used as built-in filters can generate interesting backtests, the provided External Sources can allow for even more creativity when creating strategies. This feature allows you to use many indicators from TradingView as filters or to trigger take-profit/stop-loss events, even if they aren't from LuxAlgo.
The chart below shows the HyperWave Oscillator from our Oscillator Matrix™ being used for take-profit exit conditions, exiting a long position on a profit when crossing 80, and exiting a short position when crossing 20.
🔶 Counter Trade Mode
Our thesis has always firmly remained to use Confirmation Signals within Signals & Overlays™ as a supportive tool to find trends & use as extra confirmation within strategies.
We included the counter-trade mode as a logical way to use the Confirmation signals as direct entries for longs & shorts within more contrarian trading strategies. Many traders can relate to using a trend-following indicator and having the market not respect its conditions for entries.
This mode directly benefits a trader who is aware that market conditions are generally not-so-perfect trends all the time. Acknowledging this, allows the user to use this to their advantage by introducing countertrend following conditions as direct entries, which tend to perform very well in ranging markets.
The big downfall of using counter-trade mode is the potential for very large max-drawdowns during trending market conditions. We suggest for making a strategy to consider introducing stop-loss conditions that can efficiently minimize max-drawdowns during the process of backtesting your creations.
Sensitivity Optimization
Within the Signals & Overlays™ toolkit, we allow users to adjust the Confirmation Signals with a Sensitivity parameter.
We believe the Sensitivity paramter is the most realistic way to generate the most actionable Confirmation Signals that can navigate various market conditions, and the Confirmation Signals algorithm was designed specifically with this in mind.
This script takes this parameter and backtests it internally to generate the most profitable value to display on the dashboard located in the top right of the chart, as well as an optimization table if users enable it to visualize it's backtesting.
In the image below, we can see the optimization table showing permutations of settings within the user-selected Sensitivity range.
The suggested best setting is given at the current time for the backtesting window that's customizable within the indicator. Optimized settings for technical indicators are not indicative of future results and the best settings are highly likely / guaranteed to change over time.
Optimizing signal settings has become a popular activity amongst technical analysts, however, the real-time beneficial applications of optimizing settings are limited & best described as complicated (even with forward testing).
🔶 Strategy Properties (Important)
We strongly recommend all users to ensure they adjust the Properties within the script settings to be in line with their accounts & trading platforms of choice to ensure results from strategies built are realistic.
🔶 How to access
You can see the Author's Instructions below to learn how to get access on our website.

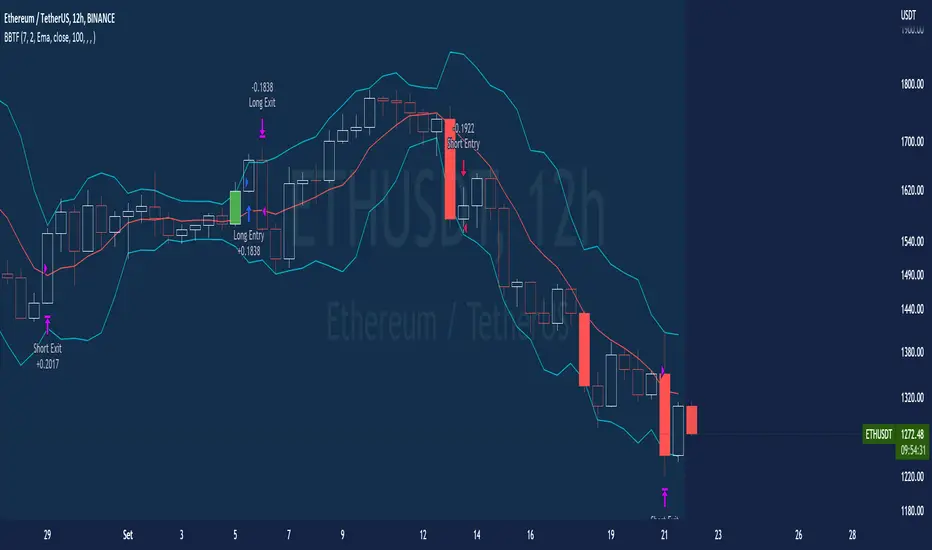
BT-Bollinger Bands - Trend FollowingEsse script foi criado para estudo de Backtest.
O script usa as Bandas de Bollinger para indicar o início de uma tendência, a entrada é configurada quando o preço abre abaixo e fecha acima da banda superior ou para venda quando o preço abre acima e fecha abaixo da banda inferior.
Não há um stop fixo e nem alvo fixo a saída se dá quando o preço toca a média da banda.
Você pode usar uma média móvel como filtro combinado com a estratégia.
O Script também pode ser usado com algum serviço de bot como 3commas.io , basta colocar as mensagens de entrada e saída para o bot.
Autor : Credsonb - Nick: M4TR1X_BR
Neste gráfico estou usando as seguintes configurações:
Bandas Bollinger: 7
Desvio Padrão: 1.5
Time Frame: 12hs
Ticker: ETH
This script was created for Backtest study.
script uses Bollinger Bands to indicate the start of a trend, entry is set when price opens below and closes above the upper band or for short when price opens above and closes below the lower band.
There is no fixed stop and no fixed target, the exit occurs when the price touches the average of the band.
You can use a moving average as a filter combined with the strategy.
The Script can also be used with some bot service like 3commas. io , just put the input and output messages to the bot.
Author : Credsonb - Nick: M4TR1X_BR
AlgoTrade DCA Bot Backtester█ OVERVIEW
This script can be used to backtest DCA Bots. It draws inspiration from 3Commas and has most settings that are available on 3Commas. It contains a few popular DCA Bot Presets that are well known in the community for you to test out! Preset used here: Kirigakure V4
█ FEATURES
DCA Preset (Custom, Standard TA,Urma Lite V3,Kirigakure V1,Kirigakure V3,Kirigakure V4)
Order Size Type (Fixed/% of equity to simulate compounding)
Base Order Size
Safety Order Size
Max Safety Trades Count
Price Deviation to open safety order %
Safety Order Volume Scale
Safety Order Step Scale
Take Profit %
Use ADR (Average Daily Range) as Take Profit
ADR length (if ADR as take profit is enabled)
Take Profit Type (% from total volume / % from base order)
Trailing Take Profit
Stop Loss
Deal Start Condition (Start ASAP) ▶ More Deal Starting Conditions will be added in the future
Bot Direction (Long / Short)
Start Time ▶ 1999-01-01 (Use this to always backtest the entire history)
End Time
This strategy also allows you to plot the Average Price and Take Profit of each trade, so it's easier to follow the trade and understand what's happening.
█ HOW TO USE
1. Select a DCA Preset and change the initial capital to the exact amount that is required (seen in the error message on top of the table). When using a Preset the following settings will be locked, meaning if you change them in the script's settings it won't have any effect:
Base Order Size
Safety Order Size
Max Safety Trades Count
Price Deviation to open safety order %
Safety Order Volume Scale
Safety Order Step Scale
Use ADR (Average Daily Range) as Take Profit
1.1 When using Presets you can choose the Order Size Type of Fixed or % of equity which simulates compounding
1.2 Choose a Direction and a Start and End Time
2. To backtest customized settings choose the preset "Custom"
2.1 All other settings are now "unlocked" and can be used
█ LIMITATIONS
Whenever a DCA preset is changed the initial_capital needs to be changed to the exact amount the settings require. If the initial_capital is not the same there will be an error of top of the table. To fix this error navigate to the Script's Settings and Properties and change the initial_capital to the same amount that is stated in the error.
DCA Bots with a high number of safety orders, e.g. 100, can run into an error that says "Maximum number of orders (9000) reached". If this error happens change the backtesting time to a shorter timeframe.
Using % of equity simulates compounding but is unrealistic because you cannot re-invest every single dollar
█ THANKS
This script in insipred by rouxam's "Backtesting 3commas DCA Bot v2" script

Short Swing Bearish MACD Cross (By Coinrule)This strategy is oriented towards shorting during downside moves, whilst ensuring the asset is trading in a higher timeframe downtrend, and exiting after further downside.
This script can work well on coins you are planning to hodl for long-term and works especially well whilst using an automated bot that can execute your trades for you. It allows you to hedge your investment by allocating a % of your coins to trade with, whilst not risking your entire holding. This mitigates unrealised losses from hodling as it provides additional cash from the profits made. You can then choose to hodl this cash, or use it to reinvest when the market reaches attractive buying levels. Alternatively, you can use this when trading contracts on futures markets where there is no need to already own the underlying asset prior to shorting it.
ENTRY
This script utilises the MACD indicator accompanied by the Exponential Moving Average (EMA) 450 to enter trades. The MACD is a trend following momentum indicator and provides identification of short-term trend direction. In this variation it utilises the 11-period as the fast and 26-period as the slow length EMAs, with signal smoothing set at 9.
The EMA 450 is used as additional confirmation to prevent the script from shorting when price is above this long-term moving average. Once price is above the EMA 450 the script will not open any shorts - preventing the rule from attempting to short uptrends. Due to this, this strategy is ideal for setting and forgetting.
The script will enter trades based on two conditions:
1) When the MACD signals a bearish cross. This occurs when the EMA 11 crosses below the EMA 26 within the MACD signalling the start of a potential downtrend.
2) Price has closed below the EMA 450. Price closing below this long-term EMA signals that the asset is in a sustained downtrend. Price breaking above this could indicate a bullish strength in which shorting would not be profitable.
EXIT
This script utilises a set take-profit and stop-loss from the entry of the trade. The take profit is set at 8% and the stop loss of 4%, providing a risk reward ratio of 2. This indicates the script will be profitable if it has a win ratio greater than 33%.
Take-Profit Exit: -8% price decrease from entry price.
OR
Stop-Loss Exit: +4% price increase from entry price.
Based on backtesting results across a selection of assets, the 45-minute and 1-hour timeframes are the best for this strategy.
The strategy assumes each order is using 30% of the available coins to make the results more realistic and to simulate you only ran this strategy on 30% of your holdings. A trading fee of 0.1% is also taken into account and is aligned to the base fee applied on Binance.
The backtesting data was recorded from December 1st 2021, just as the market was beginning its downtrend. We therefore recommend analysing the market conditions prior to utilising this strategy as it operates best on weak coins during downtrends and bearish conditions, however the EMA 450 condition should mitigate entries during bullish market conditions.

Customizable Non-Repainting HTF MACD MFI Scalper Bot Strategy v2Customizable Non-Repainting HTF MACD MFI Scalper Bot Strategy v2
This script was originally shared by Wunderbit as a free open source script for the community to work with. This is my second published iteration of this idea.
WHAT THIS SCRIPT DOES:
It is intended for use on an algorithmic bot trading platform but can be used for scalping and manual trading.
This strategy is based on the trend-following momentum indicator . It includes the Money Flow index as an additional point for entry.
This is a new and improved version geared for lower timeframes (15-5 minutes), but can be run on larger ones as well. I am testing it live as my high frequency trader.
HOW IT DOES IT:
It uses a combination of MACD and MFI indicators to create entry signals. Parameters for each indicator have been surfaced for user configurability.
Take profits are now trailing profits, and the stop loss is now fixed. Why? I found that the trailing stop loss with ATR in the previous version yields very good results for back tests but becomes very difficult to deploy live due to transaction fees. As you can see the average trade is a higher profit percentage than the previous version.
HOW IS MY VERSION ORIGINAL:
Now instead of using ATR stop loss, we have a fixed stop loss - counter intuitively to what some may believe this performs better in live trading scenarios since it gives the strategy room to move. I noticed that the ATR trailing stop was stopping out too fast and was eating away balance due to transaction fees.
The take profit on the other hand is now a trailing profit with a customizable deviation. This ensures that you can have a minimum profit you want to take in order to exit.
I have depracated the old ATR trailing stop as it became too confusing to have those as different options. I kept the old version for others that want to experiment with it. The source code still requires some cleanup, but its fully functional.
I added in a way to show RSI values and ATR values with a checkbox so that you can use the new an improved ATR Filter (and grab the right RSI values for the RSI filter). This will help to filter out times of very low volatility where we are unlikely to find a profitable trade. Use the "Show Data" checkbox to see what the values are on the indicator pane, then use those values to gauge what you want to filter out.
Both versions
Delayed Signals : The script has been refactored to use a time frame drop down. The higher time frame can be run on a faster chart (recommended on one minute chart for fastest signal confirmation and relay to algotrading platform.)
Repainting Issues : All indicators have been recoded to use the security function that checks to see if the current calculation is in realtime, if it is, then it uses the previous bar for calculation. If you are still experiencing repainting issues based on intended (or non intended use), please provide a report with screenshot and explanation so I can try to address.
Filtering : I have added to additional filters an ABOVE EMA Filter and a BELOW RSI Filter (both can be turned on and off)
Customizable Long and Close Messages : This allows someone to use the script for algorithmic trading without having to alter code. It also means you can use one indicator for all of your different alterts required for your bots.
HOW TO USE IT:
It is intended to be used in the 5-30 minute time frames, but you might be able to get a good configuration for higher time frames. I welcome feedback from other users on what they have found.
Find a pair with high volatility (example KUCOIN:ETH3LUSDT ) - I have found it works particularly well with 3L and 3S tokens for crypto. although it the limitation is that confrigurations I have found to work typically have low R/R ratio, but very high win rate and profit factor.
Ideally set one minute chart for bots, but you can use other charts for manual trading. The signal will be delayed by one bar but I have found configurations that still test well.
Select a time frame in configuration for your indicator calculations.
Select the strategy config for time frame (resolution). I like to use 5 and 15 minutes for scalping scenarios, but I am interested in hearing back from other community memebers.
Optimize your indicator without filters : customize your settings for MACD and MFI that are profitable with your chart and selected time frame calculation. Try different Take Profits (try about 2-5%) and stop loss (try about 5-8%). See if your back test is profitable and continue to optimize.
Use the Trend, RSI, ATR Filter to further refine your signals for entry. You will get less entries but you can increase your win ratio.
You can use the open and close messages for a platform integration, but I choose to set mine up on the destination platform and let the platform close it. With certain platforms you cannot be sure what your entry point actually was compared to Trading View due to slippage and timing, so I let the platform decide when it is actually profitable.
Limitations: this works rather well for short term, and does some good forward testing but back testing large data sets is a problem when switching from very small time frame to large time frame. For instance, finding a configuration that works on a one minute chart but then changing to a 1 hour chart means you lose some of your intra bar calclulations. There are some new features in pine script which might be able to address, this, but I have not had a chance to work on that issue.

Customizable Non-Repainting HTF MACD MFI Scalper Bot StrategyThis script was originally shared by Wunderbit as a free open source script for the community to work with.
WHAT THIS SCRIPT DOES:
It is intended for use on an algorithmic bot trading platform but can be used for scalping and manual trading.
This strategy is based on the trend-following momentum indicator . It includes the Money Flow index as an additional point for entry.
HOW IT DOES IT:
It uses a combination of MACD and MFI indicators to create entry signals. Parameters for each indicator have been surfaced for user configurability.
Take profits are fixed, but stop loss uses ATR configuration to minimize losses and close profitably.
HOW IS MY VERSION ORIGINAL:
I started trying to deploy this script myself in my algorithmic trading but ran into some issues which I have tried to address in this version.
Delayed Signals : The script has been refactored to use a time frame drop down. The higher time frame can be run on a faster chart (recommended on one minute chart for fastest signal confirmation and relay to algotrading platform.)
Repainting Issues : All indicators have been recoded to use the security function that checks to see if the current calculation is in realtime, if it is, then it uses the previous bar for calculation. If you are still experiencing repainting issues based on intended (or non intended use), please provide a report with screenshot and explanation so I can try to address.
Filtering : I have added to additional filters an ABOVE EMA Filter and a BELOW RSI Filter (both can be turned on and off)
Customizable Long and Close Messages : This allows someone to use the script for algorithmic trading without having to alter code. It also means you can use one indicator for all of your different alterts required for your bots.
HOW TO USE IT:
It is intended to be used in the 5-30 minute time frames, but you might be able to get a good configuration for higher time frames. I welcome feedback from other users on what they have found.
Find a pair with high volatility (example KUCOIN:ETH3LUSDT ) - I have found it works particularly well with 3L and 3S tokens for crypto. although it the limitation is that confrigurations I have found to work typically have low R/R ratio, but very high win rate and profit factor.
Ideally set one minute chart for bots, but you can use other charts for manual trading. The signal will be delayed by one bar but I have found configurations that still test well.
Select a time frame in configuration for your indicator calculations.
Select the strategy config for time frame. I like to use 5 and 15 minutes for scalping scenarios, but I am interested in hearing back from other community memebers.
Optimize your indicator without filters (trendFilter and RSI Filter)
Use the TrendFilter and RSI Filter to further refine your signals for entry. You will get less entries but you can increase your win ratio.
I will add screenshots and possibly a video provided that it passes community standards.
Limitations: this works rather well for short term, and does some good forward testing but back testing large data sets is a problem when switching from very small time frame to large time frame. For instance, finding a configuration that works on a one minute chart but then changing to a 1 hour chart means you lose some of your intra bar calclulations. There are some new features in pine script which might be able to address, this, but I have not had a chance to work on that issue.

The Impossible TraderTHE IMPOSSIBLE TRADER
A simple, but effective High Freq Strategy script based on MACD or RSI trend, with extra customizable Alert Messages for Bots.
WHAT IT DOES
This script (works best at lower TimeFrames) just follow the trend of MACD or RSI on your asset.
Why it should work? Because in an upper trend, there are more chance of green candles than reds. And in dump trend there are more chance of red candles than greens.
While trend is positive, it will try to open Long orders as fast as possible at market price.
While trend is negative, it will try to open Short orders as fast as possible at market price.
HOW TO SETUP YOUR PREFERENCES
Capital : Insert a % of Margin you want to use for your positions (usually 30% is quite good)
Leverage : Choose leverage based on your plans
Trail Tick @ : This value (in Tick) tell the script "when" the "Trail Stop" order must be activated (from the Entry price)
Offset Tick @ : This is the price (in Tick) from the Trail Stop Price activated. Basically it is a Stop Loss that follow the price at a fixed distance.
SL Tick @ : Set a Stop Loss at amount Tick distance from the Entry Price. (Let's call it a Safety Stop Loss for bad decisions...)
TP Tick @ : Set a Take Profit at amount Tick distance from the Entry Price. Sometimes is better to exit in full Gain than keep positions.
Strategy : You can choose a Only Long, Only Short or Long+Short sametime strategy.
with MACD or RSI : You can try the strategy applied on MACD or applied on customizable RSI EMA
EMA : If you choosed RSI EMA, you can set any value for your testing (usually 80-120 works very nice)
Exit order after bars : Some Exchanges / Brokers apply fixed cost, and a strategy too fast could not be productive. This set will let you to delay the Exit Order on already Opened positions.
Keep Stop Loss active : If you are planning a delay for Exit Orders, sometime could be useful to keep activated Stop Loss.
Strategy Preset : Some preset I've found interesting, with good results.
BackTest Days : If there are too many results and script doesn't work, you can choose a closer range to show results.
EXTRA FEATURES
On Screen Display : OSD will show you some realtime stats about your strategy, like Asset Tick, Trading Period Range, Drawdown, Gains and not closed trade.
Alert Message : You can enter custom Long Entry/Exit and Short Entry/Exit message for your Bots (like AutoView, WunderBit, etc...). When alert is triggered, you can send custom message with {{strategy.order.comment}} in the text field
AutoView Alert Message : If you are user of AutoView, you can generate your calls. Those are tested only on Oanda with index like Sp500, US100, Us30.
TIPS ON USE
Some asset on TradingView require an higher initial capital. Go to this Script Settings -> Properties and rise Initial Capital.
Be aware of commissions and spread when evalutating a strategy. Go to this Script Settings -> Properties and set Commission and Slippage
Trail Stop and Ticks could be difficult to understand, but very profitable. Please take your time and study how it works.
Consider Tick like the minimum movement your asset can do. Ticks occurs "intra-bar", so some of your positions could be closed almost instantly.
Consider Trail Stop like a Stop Loss that keep always the same distance from your positions, but never came back . If you are in gain, say of 10 Ticks, and your Trail have 5 Ticks, this means for sure a close at minimum 5 Ticks from Entry Price.
On Screen Display will show you Ticks for your asset. This will help you on strategy settings, because not all asset responds on the same way.
ONLY LONG EXAMPLE
ONLY SHORT EXAMPLE

hammerCandle & starCandleIn this scrip we have combine Pinbar Candlesticks calculated using Fibonacci, the bullish hammer candlestick and bearish star candlestick with EMAs and ATR.
I have used 12 Hour time frame which works well EUR/USD, this script works well on higher time frames such as Daily, 12 hours etc.
I have used 1.5 times the ATR as the stop loss and 1 times the ATR as the take profit as these risk to reward ratio gives us the best results for the 12 hour time frame for EUR/USD. Past result are not a prove of performance of the future.
I have added 1 for slippage and 1 for commission.
This script contains AutoView syntax and is fully automated if you connect TradingView to AutoView and a broker, prefebly Oanda.
This script uses two exponential moving averages for trend detection and Average True Range , ATR for stop loss and take profit targets. All of these setting are adjustable.
We only trade with the trend if the 50 period exponential moving averages is above the 200 period exponential moving averages, if a hammer candle is formed for entry.
Likewise with sell trade if a star candle is formed for entry and if the 50 period exponential moving averages is below the 200 period exponential moving averages.
This script does not trail your stop loss as I have noticed it does not give me good results. Stop loss is a fix stop loss based on Average True Range and so is the profit target.
This script has risk management, it risk a certain percent of the inputted capital amount in the setting. See settings for more details.
Note: Due to auto risk management this script only works on Forex.
Green line is 50 period exponential moving averages and red line is the the 200 period exponential moving average . Blue line is stop loss for long trade and black line stop loss for short trade.
Please trade at your own risk, all the setting in the script are adjustable for you to test before trading.
Many Thanks,
Honet Trader